BIMxHTML v0.0.8 – More Custom Nodes to Generate Google Charts
It looks like there has been some interest in the BIMxHTML Dynamo package and its encouraged me to develop some custom nodes to simplify the display of Google Charts using pure Dynamo.
The Custom Nodes
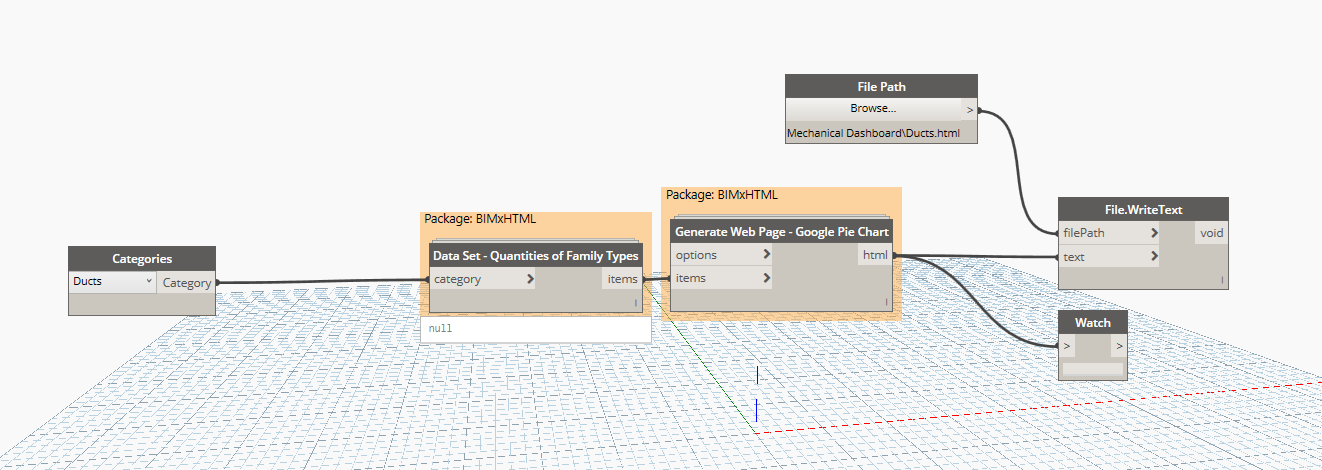
Download the sample files below to get a good example of how to use these nodes. Essentially, they output an entire web page and as of today the intent is to use them in the iframes of a dashboard.
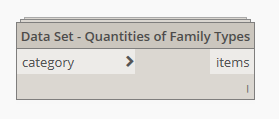
Data Set – Quantities of Family Types.dyf
Use this node to build a dictionary of family types of any given category. The output is actually a list of sublists which contain the [key, value] pairs as [family type, quantity]. For example: [Diffuser24x24, 17].
This node is helpful to use for the input of any of the Google Chart nodes.
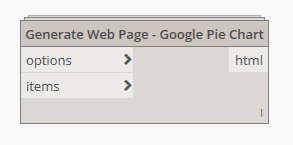
Generate Web Page – Google Pie Chart.dyf
Creates the complete web page to display a responsive pie chart based on the Google Charts API. The intent for the HTML file is to reference it in an iframe for a dashboard (more on that to come).
Refer to the Google Charts documentation for options input.
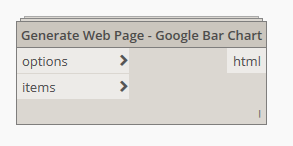
Generate Web Page – Google Bar Chart.dyf
This node takes the same exact input as the Pie Chart node and outputs a bar graph.
Refer to the Google Charts documentation for options input.
Sample Files
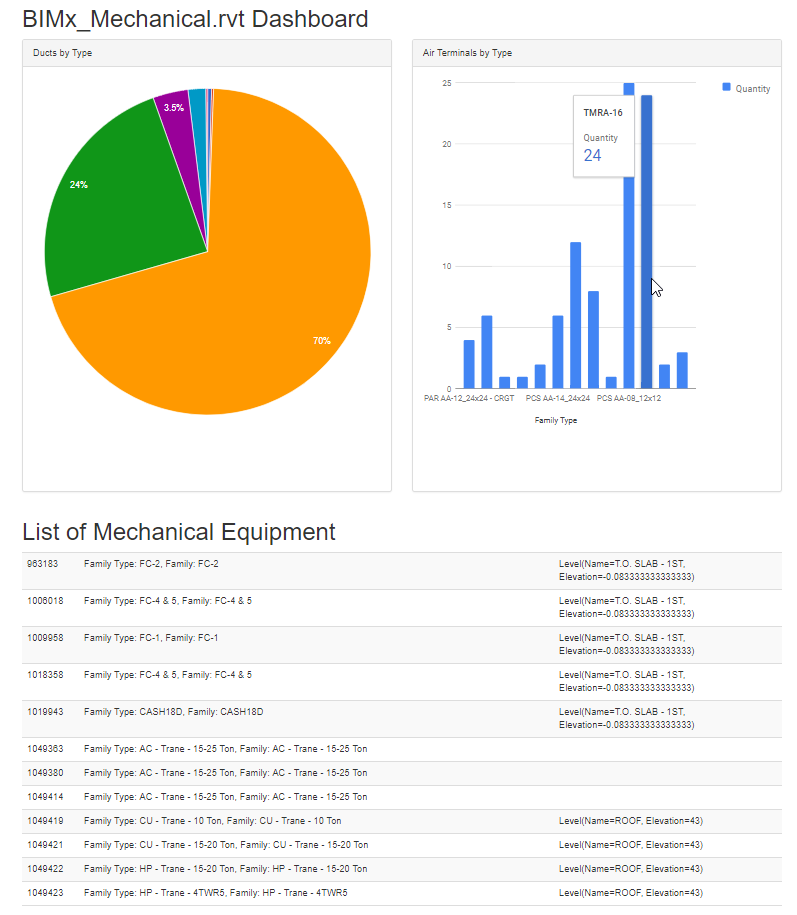
Refer to the sample Dynamo graphs below to get a better idea of how to use these nodes. Dashboard-Mech.html is currently the best example because it displays a pie chart, a bar chart, and a table – all generated directly from Dynamo.
BIMxHTML-Examples-v0-2.zip (720 downloads)