BIMxHTML – A Dynamo Package to Generate Web Pages
All of the excitement revolving around generating dashboards using Power BI made me wonder: Can we leverage Dynamo to create web pages that display data directly from a Revit model? The goal would be to create a powerful, free alternative to generating web-based content using simple HTML code.
Needless to say, the gears have been turning and I have been experimenting. With that said, I have published my first Dynamo package, BIMxHTML, which will eventually have several nodes to display content on a web page using very basic HTML. I have been playing with Twitter Bootstrap and Google Charts so far.
Update: New nodes have been published to v0.0.8 which streamline the creation of Google Charts. Read up on the nodes here:
http://bimextension.com/bimxhtml-v0-0-8-more-custom-nodes-to-generate-google-charts/
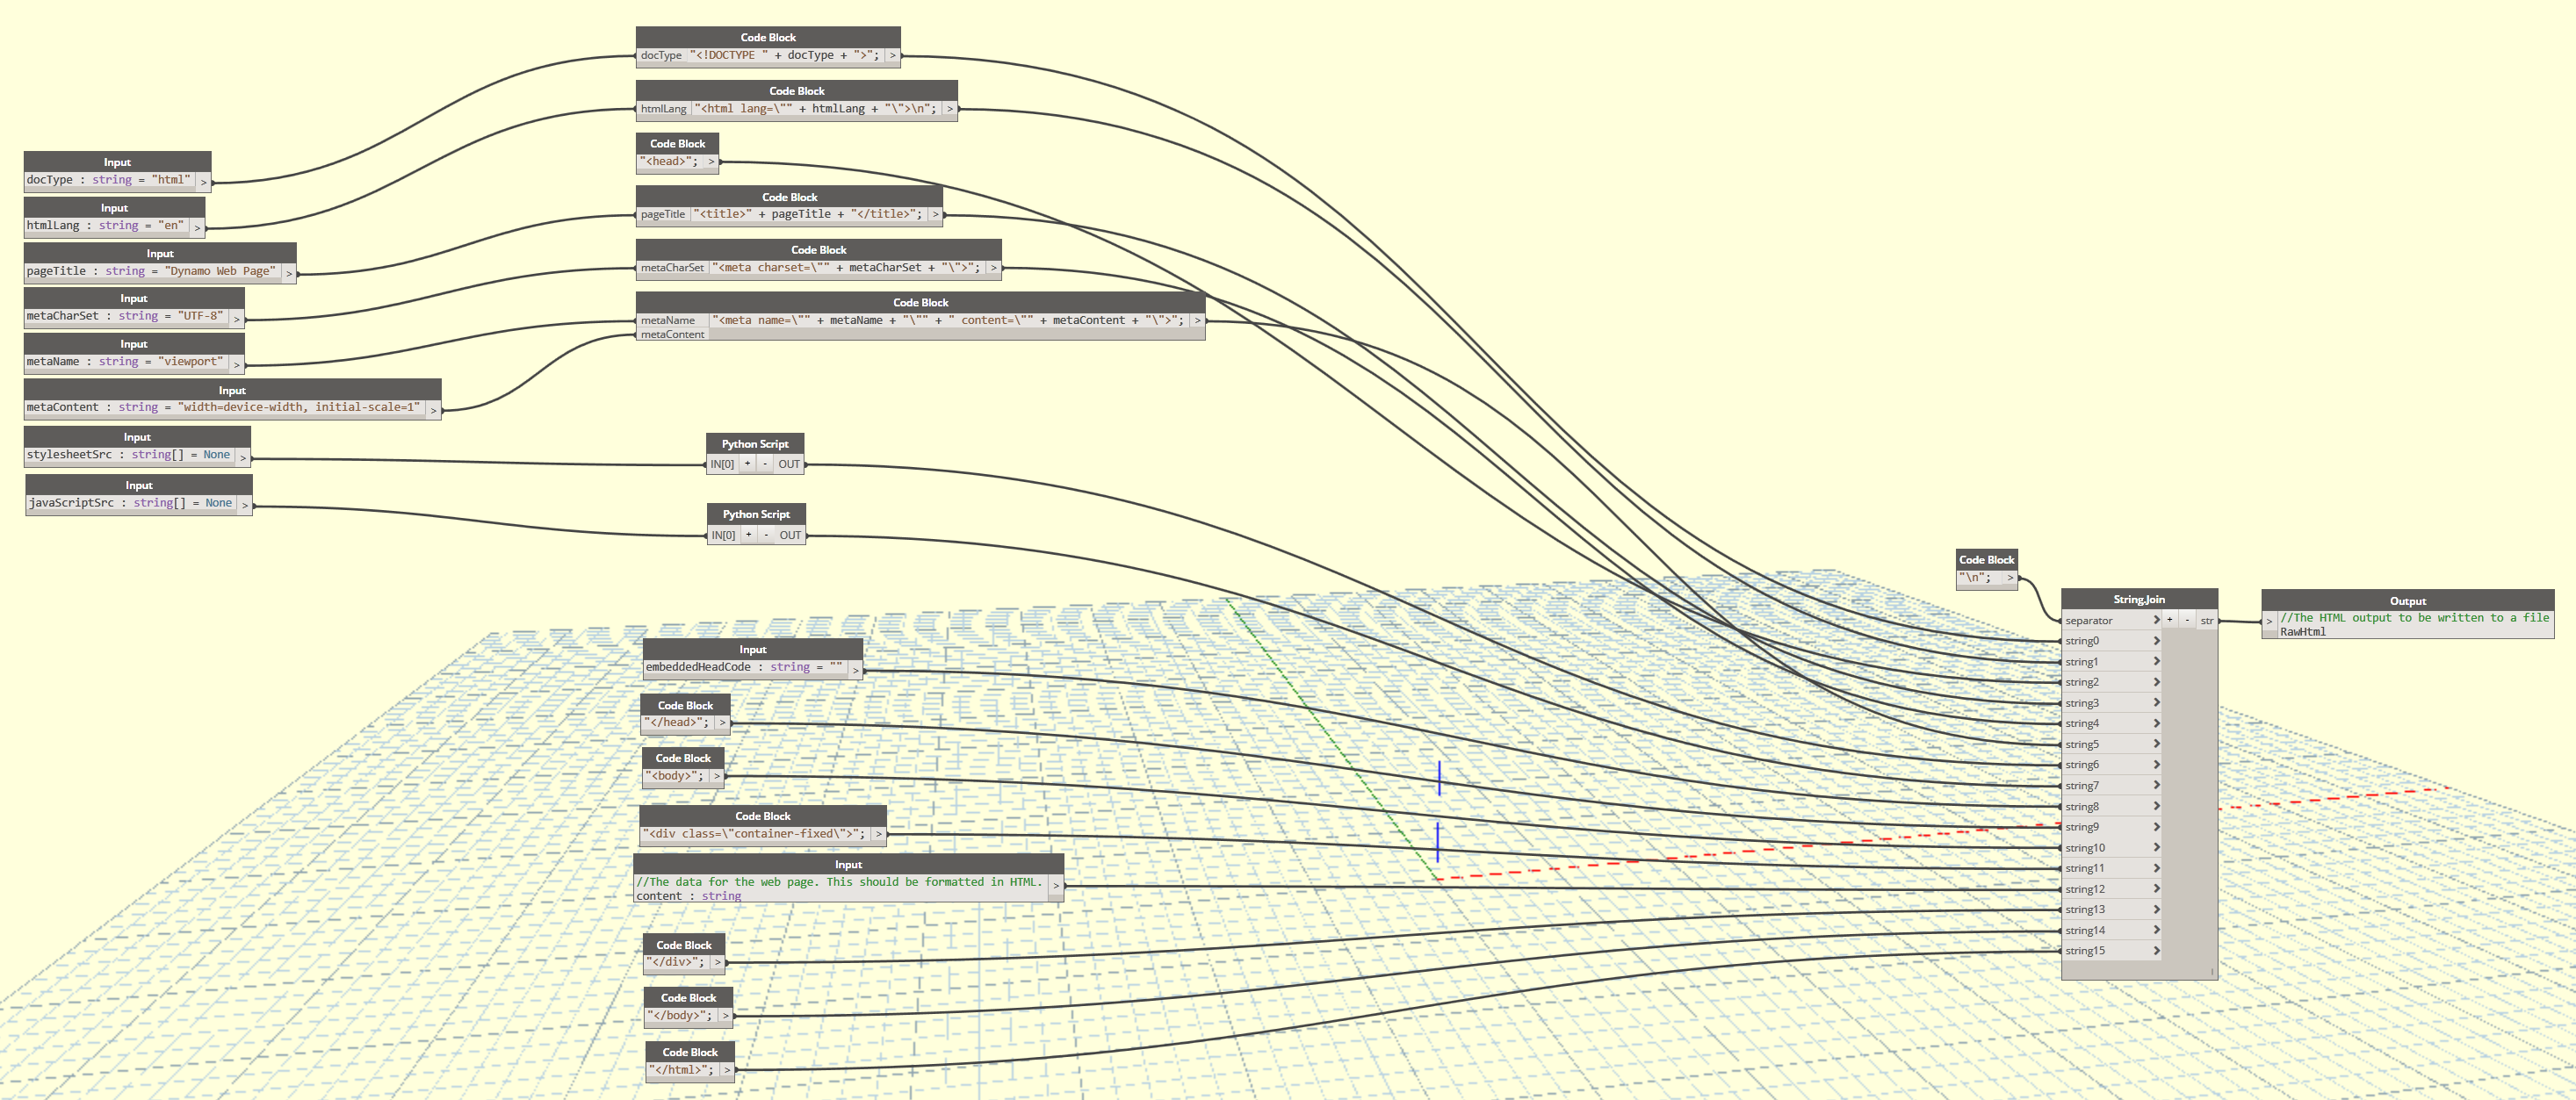
For now a single node is included in the BIMxHTML package: Generate Web Page.
The inputs for Generate Web Page contain several default values for configuring the <head> of the web page. I have also included inputs to allow users to link to external CSS stylesheets and JavaScript files or embedded code for custom <style> or <script> tags. All without managing the template’s HTML directly.
I have a sample model and graph for you to see the node in action available for download below.
Sample Files Explained
There are a few sample graphs included in the download below. Please keep in mind that these are extremely early examples of the possibilities of using Dynamo to extract Revit data and output HTML for display in any modern browser. Currently, I have been experimenting with a combination of Twitter Bootstrap and Google Charts, but if you have any suggestions on other frameworks or analytics tools, please make a suggestion in the comments below.
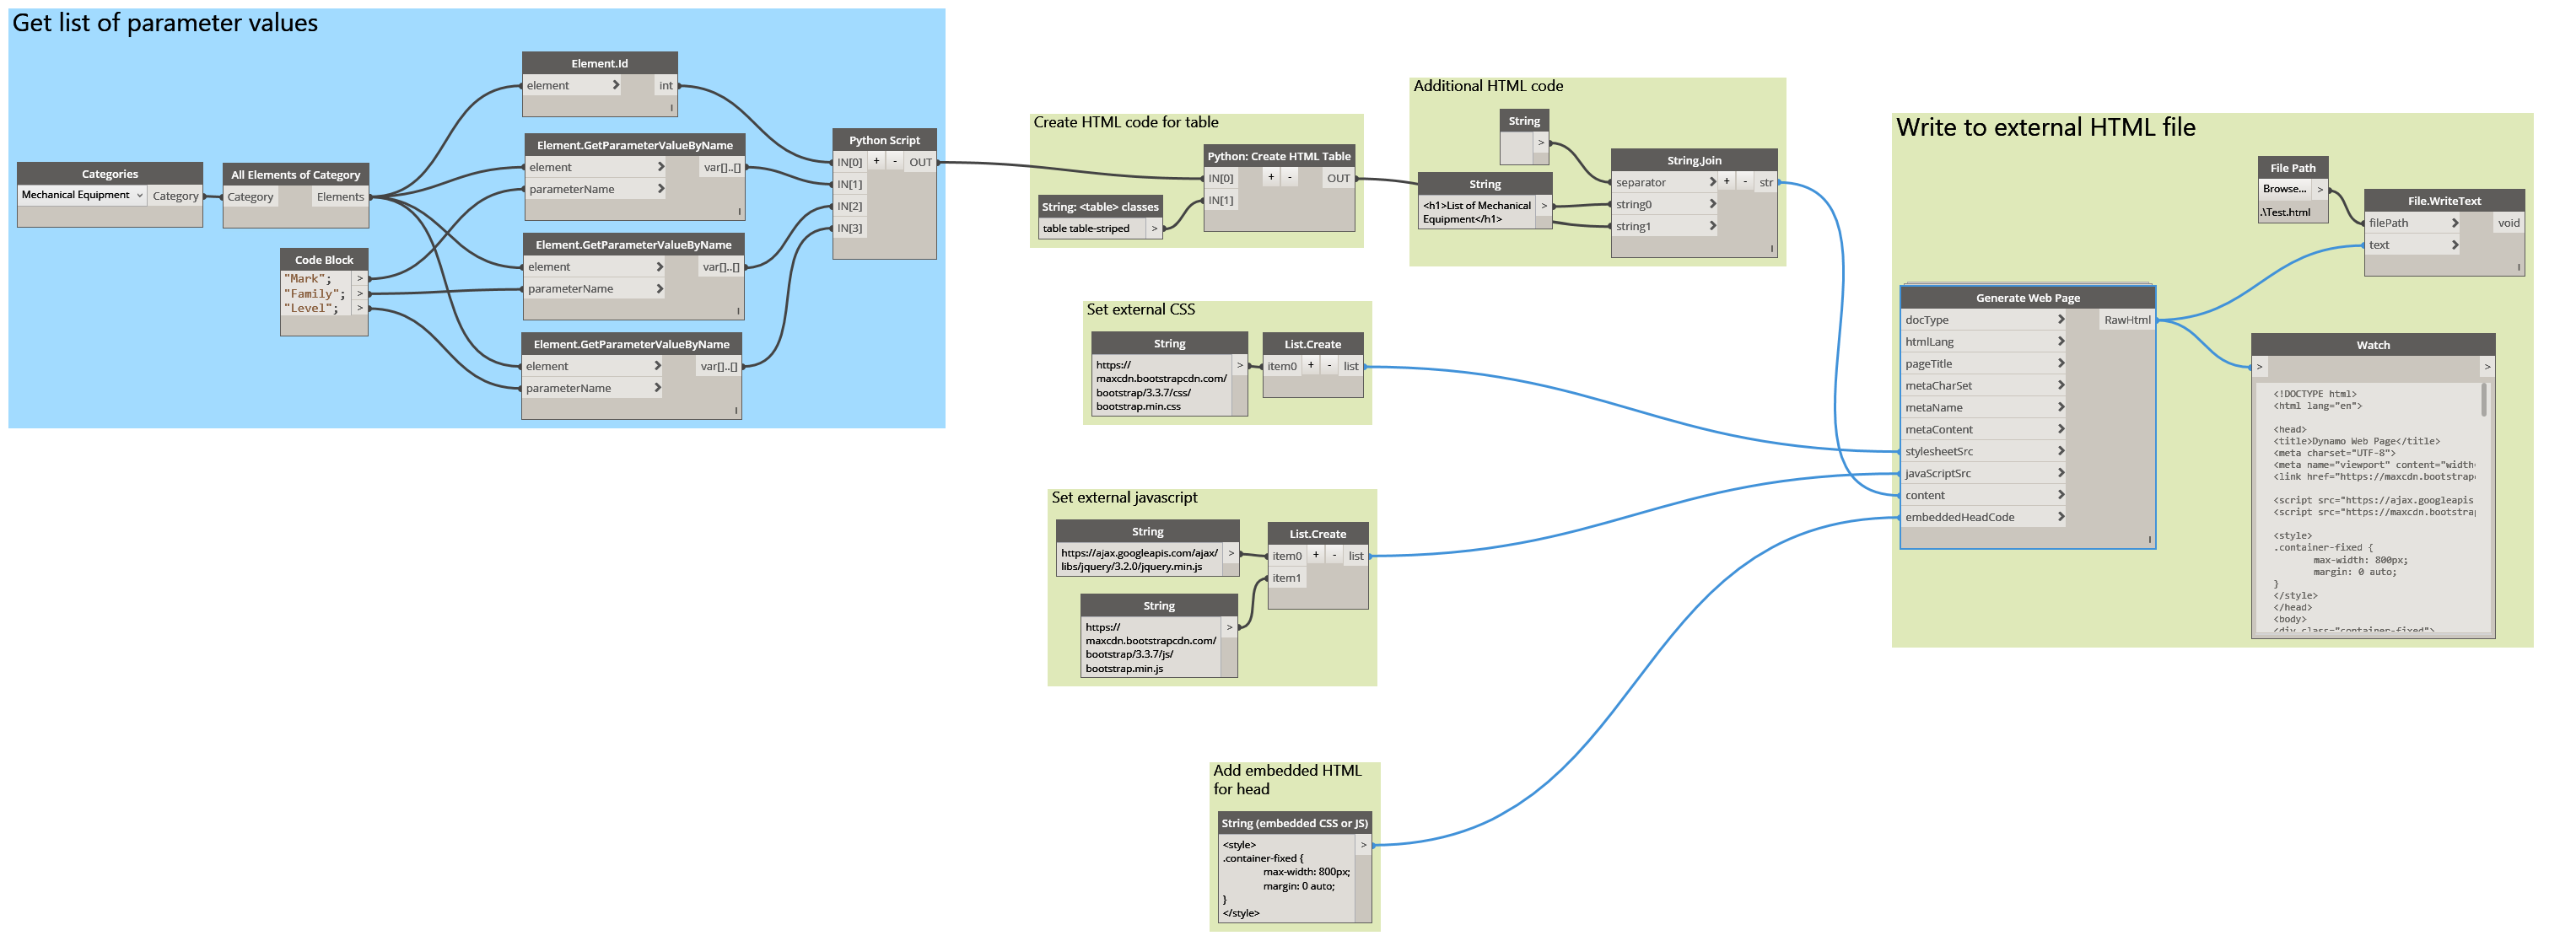
Table Sample.dyn (TableTest.html)
Creates a list with parameter values as sublists.
- Using Python, the HTML code for a table is generated using each list item as a table row and each sublist item as a column value. Note: a custom node will be added to this package to handle this in the near future.
- Finally, the Generate Web Page node from the BIMxHTML package creates the entire web page’s code and then writes the code to an external HTML file.
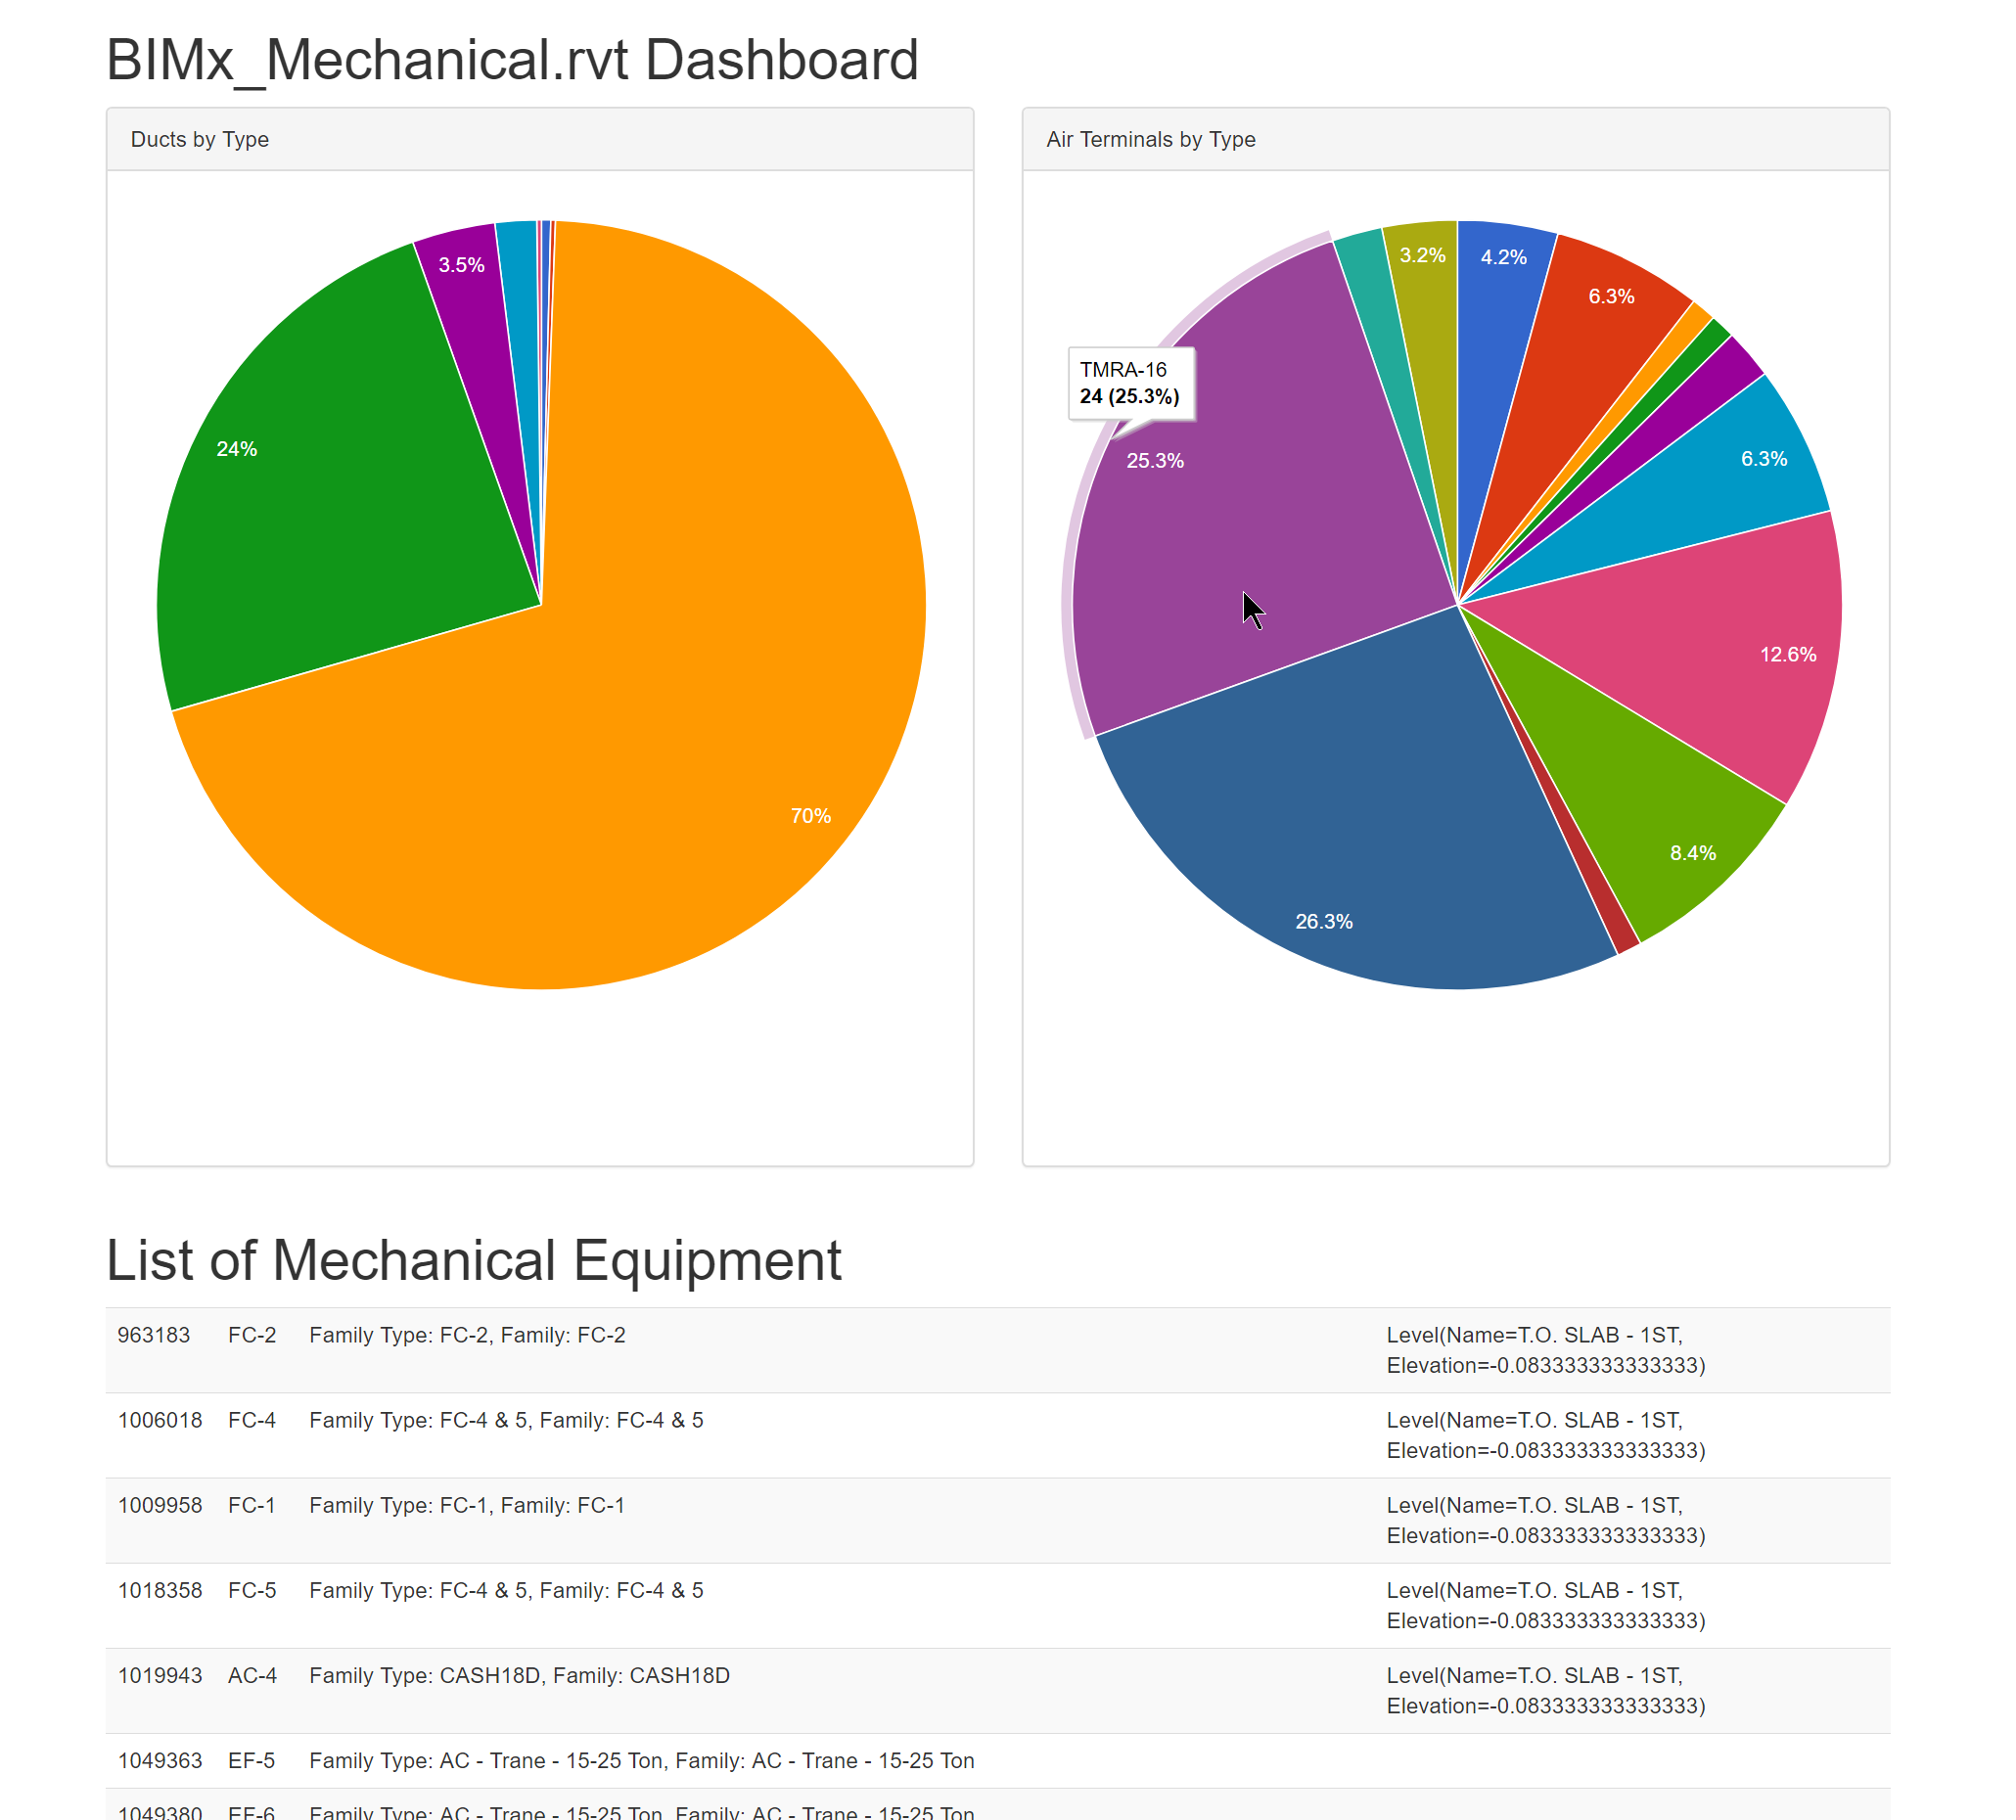
Google Charts – Pie Chart.dyn (Air Terminals.html / Ducts.html)
Creates an HTML page containing a Google Charts pie chart displaying the quantity of family types per category.
Dashboard.html
A sample Bootstrap layout which uses iframes to display the pie charts generated from Google Charts – Pie Chart.dyn.
Feedback?
Would these tools help you with your workflows? Do you have any suggestions on how I can improve on these? Would you like to help contribute? Please leave your questions and comments below.
BIMxHTML-Sample-Files-1.zip (935 downloads)